A dot plot (aka contact plot or residue contact map) is a graphical method that allows the comparison of two biological sequences and identify regions of close similarity between them. It is a kind of recurrence plot.
The simplest way to visualize the similarity between two protein sequences is to use a similarity matrix, known as a dot plot. These were introduced by Philips in the 1970s and are two-dimensional matrices which have the sequences of the proteins being compared along the vertical and horizontal axes. For a simple visual representation of the similarity between two sequences, individual cells in the matrix can be shaded black if residues are identical, so that matching sequence segments appear as runs of diagonal lines across the matrix. Some idea of the similarity of the two sequences can be gleaned from the number and length of matching segments shown in the matrix. Identical proteins will obviously have a diagonal line in the center of the matrix. Insertions and deletions between sequences give rise to disruptions in this diagonal. Regions of local similarity or repetitive sequences give rise to further diagonal matches in addition to the central diagonal. Because of the limited protein alphabet, many matching sequence segments may simply have arisen by chance. One way of reducing this noise is to only shade runs or 'tuples' of residues, e.g. a tuple of 3 corresponds to three residues in a row. This is effective because the probability of matching three residues in a row by chance is much lower than single-residue matches. It can be seen from Figures 3.3h,c that the number of diagonal runs in the matrix has been considerably reduced by looking for 2-tuples or 3-tuples. Dot Plots are one of the oldest ways of comparing two sequences. They compare two sequences by organizing one sequence on the x-axis, and another on the y-axis, of a plot. When the residues of both sequences match at the same location on the plot, a dot is drawn at the corresponding position. Note, that the sequences can be written backwards or forwards, however the sequences on both axes must be written in the same direction. Also note, that the direction of the sequences on the axes will determine the direction of the line on the dot plot. Once the dots have been plotted, they will combine to form lines. The closeness of the sequences in similarity will determine how close the diagonal line is to what a graph showing a curve demonstrating a direct relationship is. This relationship is affected by certain sequence features such as frame shifts, direct repeats, and inverted repeats. Frame shifts include insertions, deletions, and mutations. The presence of one of these features, or the presence of multiple features, will cause for multiple lines to be plotted in a various possibility of configurations, depending on the features present in the sequences. A feature that will cause a very different result on the dot plot is the presence of low-complexity region/regions. Low-complexity regions are regions in the sequence with only a few amino acids, which in turn, causes redundancy within that small or limited region. These regions are typically found around the diagonal, and may or may not have a square in the middle of the dot plot. Example
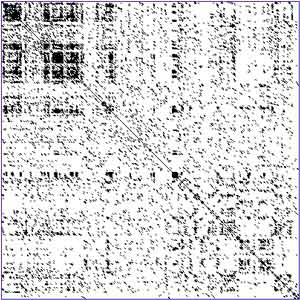
A DNA dot plot of a human zinc finger transcription factor (GenBank ID NM_002383), showing regional self-similarity. The main diagonal represents the sequence's alignment with itself; lines off the main diagonal represent similar or repetitive patterns within the sequence. (*) Example of a dot plot for comparing two simple protein sequences: 1. All cells associated with identical residue pairs between the sequences are shaded black; This is constrained to be within the window given by the two black lines parallel to the central diagonal. An alternative high-scoring path is also shown. See also * Protein Contact Map
* A tutorial Retrieved from "http://en.wikipedia.org/"
|